
**** Info via Environment Canada
June temperature outlook
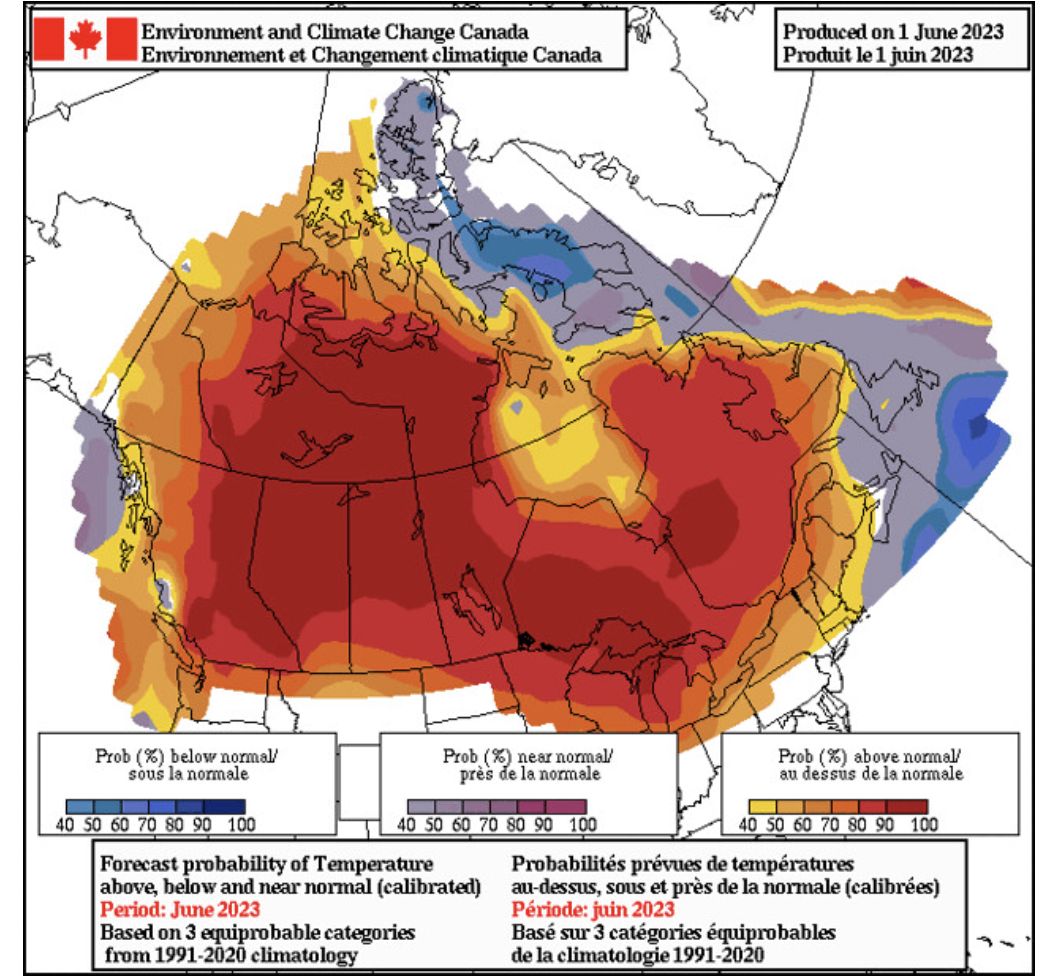
Today is officially the first day of meteorological summer! With that, let’s look at the temperature map for June to see whether temperatures in your region will be below or above average.
The forecasts are categorized as follows:
- blue indicates the probability that temperatures will be below normal;
- grey to purple indicates the probability that temperatures will be near normal;
- yellow to red indicates the probability that temperatures will be above normal; and
- white indicates uncertainty regarding the temperature tendency this month.

All categories are compared to the 30 months of June between the 1991-2020 period. This map is a prediction of the daily average temperature anomaly (difference from normal) at 2 metres, the standard forecast height. It is not a daily maximum or minimum temperature forecast.
Long-range forecast user guide.
May overview
May began with heavy rainfall across parts of Quebec and the Maritimes, but dry conditions ended up prevailing. By the end of the month, most of the country had received below-average precipitation helping to fuel the many fires across the country.

Map of precipitation anomalies (difference from normal) for May. As we can see, most of the country received below-average precipitation.
May greeted the West and North with well above average temperatures that stayed in place most days, with many daytime maximum temperature records being broken. On the other side of the country, despite the dryer-than-normal conditions, eastern Canada saw temperatures closer to average in May.

This map shows how temperatures in May were different from the average for this month.
On May 27, Canada saw its first tornado of the year when an EF1 rated tornado developed near the city of Regina in Saskatchewan.


