**** Info via Environment Canada
February Temperature Outlook
January overview
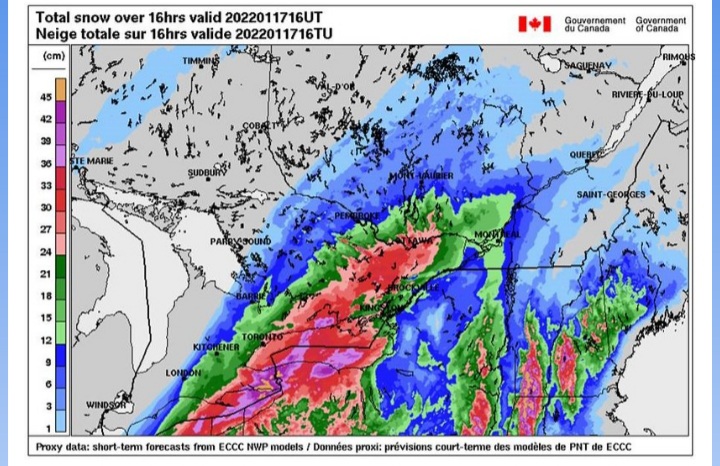
Widespread winter weather conditions tracked eastwards into central and eastern Canada in mid-January, providing much-needed relief from the previous period of relentless cold and snow in the west. Winter storms pummelled Atlantic Canada on the 15th, 16thand 17th. Meanwhile, over 10 million people, including those in both the City of Toronto and the City of Ottawa, woke up to very rare blizzard warnings on January 17th.

On January 29th, a strong and messy low-pressure system swept through Atlantic Canada, bringing strong winds, rain, and snow and blowing snow before departing over the Labrador Sea on Sunday night.
| Location | Precipitation | Wind Gusts |
| Halifax, NS | 15-20 cm | 91 km/h |
| Sydney, NS | 53-71 cm | 104 km/h |
| Moncton, NB | 40 cm | 89 km/h |
| Saint John, NB | 26 cm | 93 km/h |
| Charlottetown, PE | 37 cm | 104 km/h |
| Gander, NL | 9 cm | 109 km/h |
| St. John’s, NL | 77 mm (rain) | 93 km/h |
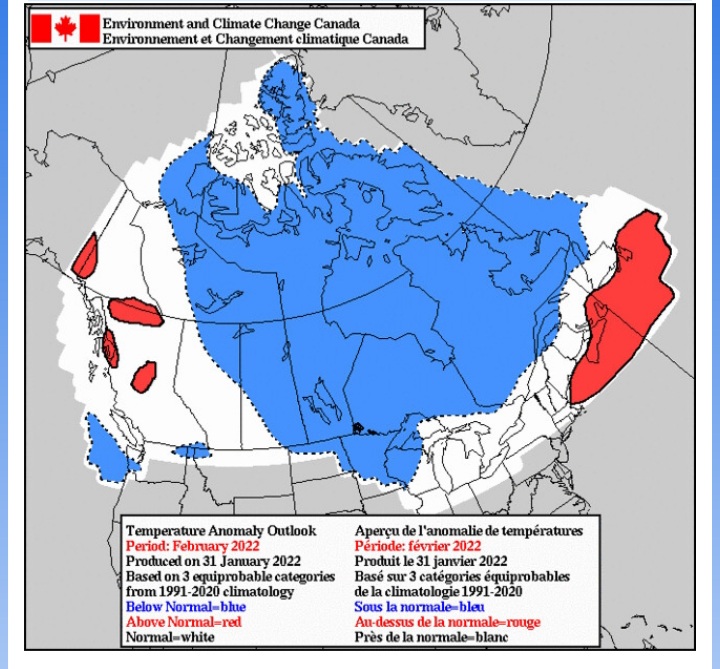
Here is the forecast for the “temperature anomaly” for the month of February. The temperature anomaly is the “difference from normal temperatures” for the entire month.
The forecasts are categorized as:
- blue indicates below normal temperatures;
- white (no colour) indicates near-normal temperatures; and
- red indicates above normal temperatures – all categories are compared to the 30 seasons of the 1991-2020 period.

This is a prediction of the anomaly of the mean daily temperature at 2 metres (i.e., at standard temperature observation height). It is not a forecast of the maximum nor of the minimum daily temperature.
Long-range forecast user guide.


