
**** Info via Environment Canada
October temperature outlook
September’s recap
Temperature and Precipitation:
September was another hot month across most of Canada. The Prairies saw temperatures in most areas 3+ degrees warmer than the average for the month, and precipitation was generally lower than the average across the west. Southern Quebec, New Brunswick, Prince Edward Island and Nova Scotia saw above-average precipitation, with most of the rain in the Maritimes coming at the end of the month.
Post-Tropical Storms: Earl and Fiona
With Hurricane season nearing its peak, two post-tropical storms affected Atlantic Canada. Hurricane Earl became post-tropical as it tracked across the southern Grand Banks of Newfoundland the weekend of September 10-11 before bringing heavy rainfall across most of the Avalon Peninsula over the weekend and into Monday the 12th. Rainfall amounts near 200 mm were observed at several locations. St. John’s Airport received more than its normal monthly rainfall total for the entire month of September with Earl. This was also the two-day period with the most precipitation at this station since April 1951.
On Sept 15th tropical depression Fiona formed over the central tropical Atlantic; on September 18th, Fiona intensified into a category 4 Hurricane. Fiona made landfall the morning of September 24th as a post-tropical cyclone near the town of Whitehead in Nova Scotia with category-2 hurricane strength. Fiona generated damaging winds, torrential rainfall, large waves and destructive storm surge across the Atlantic Provinces and parts of Quebec. Fiona’s central pressure, when it made landfall in Nova Scotia, is expected to be the lowest recorded barometric pressure in Canadian history.
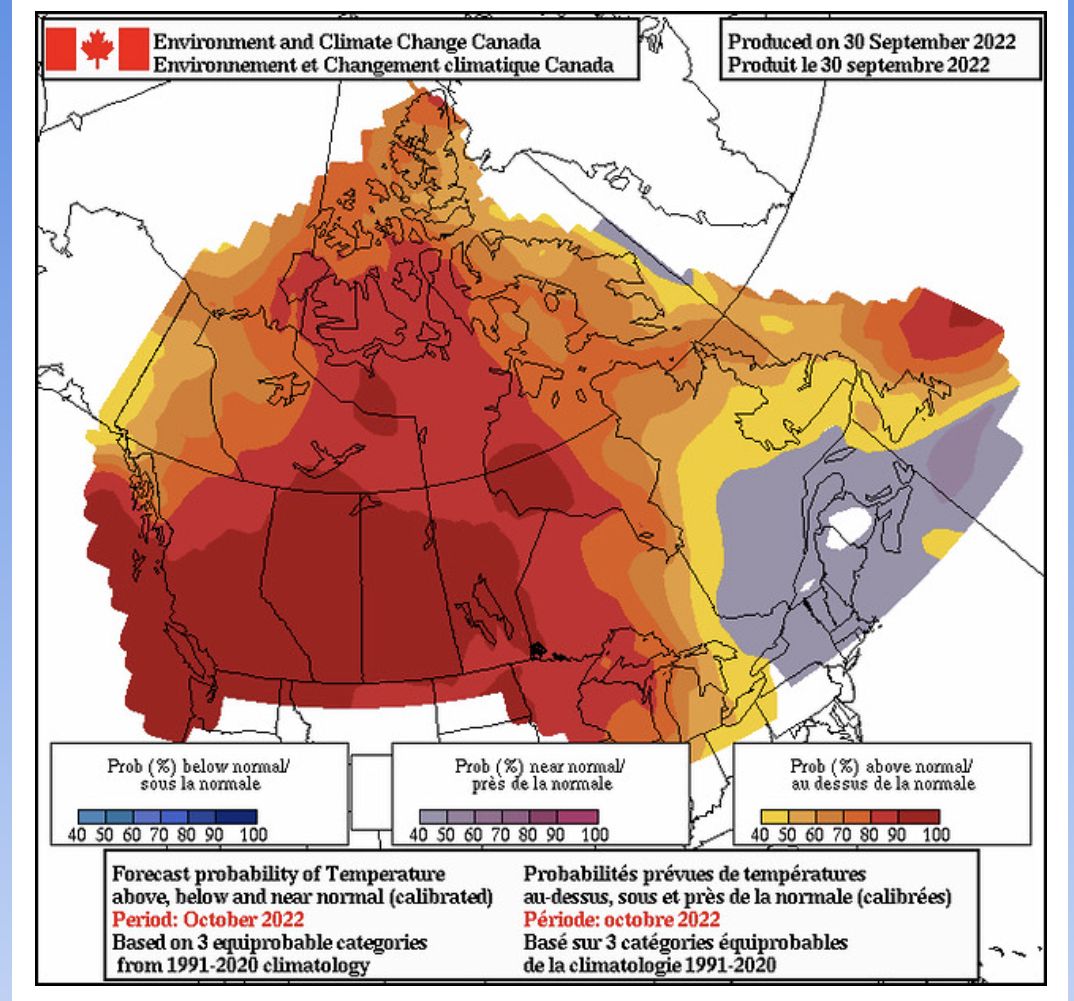
Outlook for the month of October
Here is the forecast for the “temperature anomaly” for the month of October. The temperature anomaly is the “difference from normal temperatures” for the entire month.
The forecasts are categorized as follows:
- blue indicates the probability that temperatures will be below normal;
- grey to purple indicates the probability that temperatures will be near normal; and
- yellow to red indicates the probability that temperatures will be above normal.
*All categories are compared to the 30 seasons of the 1991-2020 period.

This is a prediction of the anomaly of the mean daily temperature at 2 metres (i.e. at standard temperature observation height). It is not a forecast of the maximum nor of the minimum daily temperature.
Long range forecast user guide.