
**** Info via Environment Canada
August Temperature Outlook
The month of July brought many severe weather events upon us this year, with prolonged heat waves and tornadoes.
Heat:
A prolonged and significant heat wave affected the Arctic during the first two weeks of July. On July 7, in the Northwest Territories daily temperatures reached a scorching 33.7 °C at Little Chicago, and a record-breaking 32.6 °C in Inuvik, whereas the previous record was 29.6 °C set in 2017.
Southern Ontario reported temperatures in the low 30s on July 19, before the heat spread to the Maritimes from July 20 – 25, where many daily temperature records were broken.

A significant heat wave affected British Columbia (BC) and Alberta in the last week of July. A long list of daily temperature records was set on July 26th and 27th, with Lytton in BC reporting 42.0 °C on July 26. The heat wave prolonged the flood watch in BC with ongoing snow and glacier melts. This same heat wave also kick-started several wildfires, and has significantly increased risks for heat illness.
Tornadoes:
Seventeen tornadoes were reported in July across the Prairie Provinces, Ontario and Quebec. On July 7, an EF-02 Tornado near Bergen, in Alberta, damaged several homes, power poles and trees.
On July 23, severe thunderstorms developed north of the St Lawrence River. Strong wind gusts and large hail were reported, and an EF-02 tornado hit the municipality of Saint-Adolphe-D’Howard, located North of Montreal, in the Laurentians Mountains. The thunderstorm then raced across parts of southern and eastern Ontario the same evening, causing power outages for over 40 000 customers. An EF-02 supercell tornado, with a track length of 55.8 km, was spotted from Rockdale to Actinolite, Ontario. Sadly, multiple injuries and widespread structural damage were reported.
Here is the forecast for the “temperature anomaly” for the month of August. The temperature anomaly is the “difference from normal temperatures” for the entire month.
The forecasts are categorized as follows:
- blue indicates the probability that temperatures will be below normal;
- grey to purple indicates the probability that temperatures will be near normal; and
- yellow to red indicates the probability that temperatures will be above normal.
*All categories are compared to the 30 seasons of the 1991-2020 period.
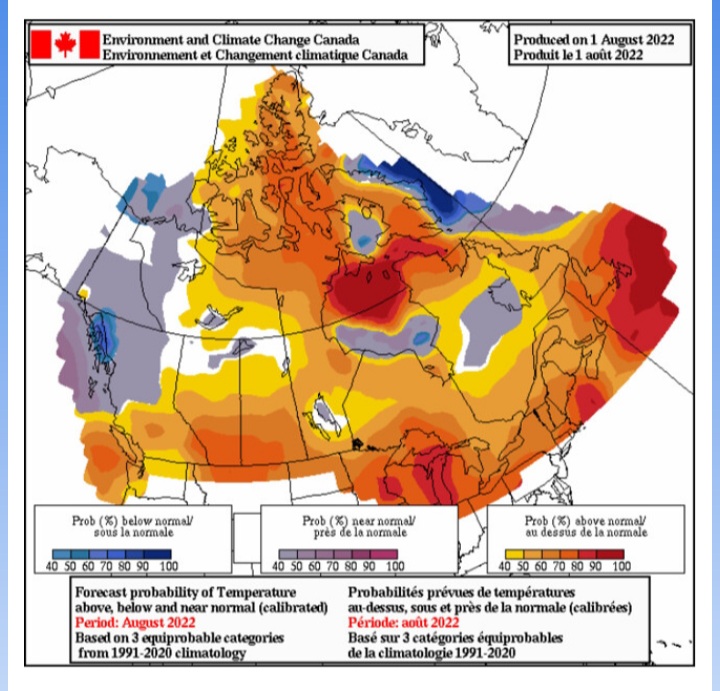
This is a prediction of the anomaly of the mean daily temperature at 2 metres (i.e., at standard temperature observation height). It is not a forecast of the maximum nor of the minimum daily temperature.
Long-range forecast user guide.