**** Info via Environment Canada
January Weather Outlook
Before looking into 2022, let’s have a quick look at the last few months of 2021 where several locations in British Columbia (BC) finished the year quite wet! In fact, it was the wettest September-October-November (meteorological fall) period on record in the following locations:
| Sept-Oct-Nov 2021 | Precipitation (mm) | Normal precipitation (mm) | Percentage of normal |
| Victoria Gonzales | 509.6 | 230.1 | 221.5% |
| Nanaimo Airport | 619.8 | 341.8 | 181.3% |
| Vancouver | 611.5 | 364.4 | 167.8% |
| Abbotsford | 884.5 | 474.8 | 186.3% |
However, meteorological winter roared into life (December 1, 2021) with record-breaking heat in BC! Numerous records were set with the most notable being in Penticton at 22.5 °C breaking the previous provincial monthly record by more than 3 °C and tying the national December record – previously set in Hamilton, ON on December 3rd in 1982. That same day, strong chinook winds blasted through southern Alberta with widespread wind gusts in excess of 100k km/h, peaking at Waterton Parke Gate at 148 km/h.
Unfortunately, much of western Canada shivered through the last week of December, as a record-breaking cold snap ended the year.
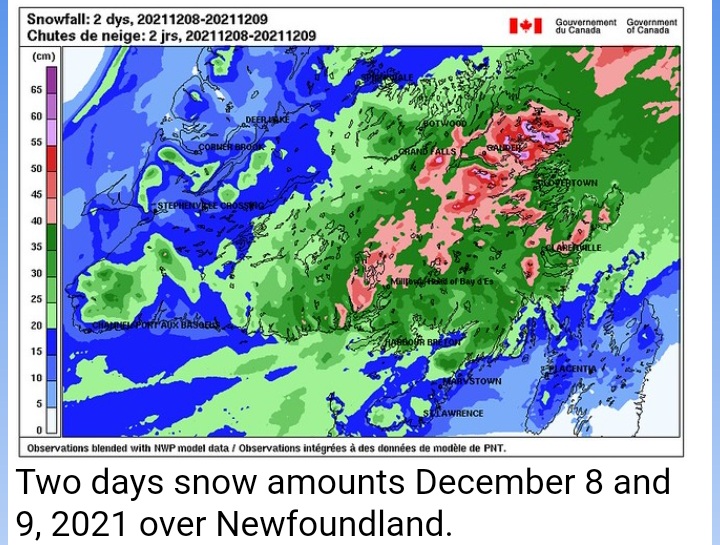
A low-pressure system formed off Cape Hatteras on December 8 and rapidly intensified as it was passing east of the Avalon Peninsula, NS on December 9. The storm brought a wide swath of snow to parts of Nova Scotia before moving through Newfoundland. Very strong winds also accompanied the system.
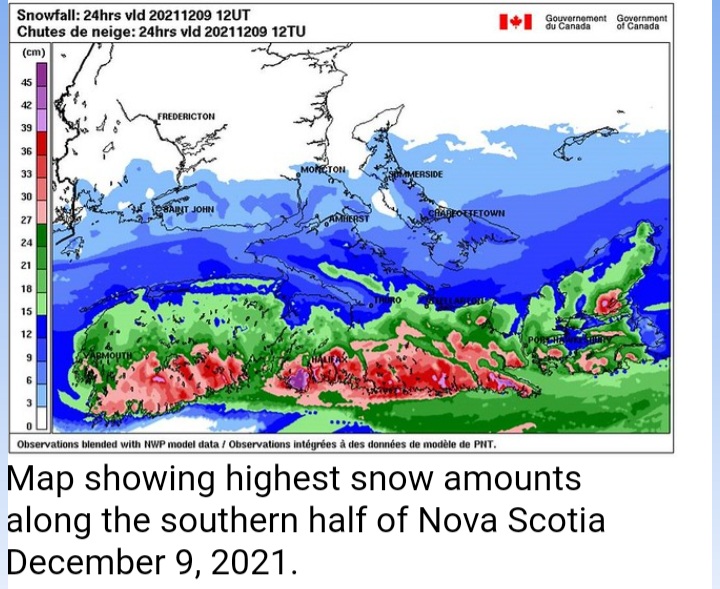
Dartmouth to Tarbot in Nova Scotia received 38 cm, while the City of Halifax had a rare thundersnow event through the night of the 9th. Meanwhile Gander, NL got walloped with 46 cm while St John’s received 17.8 cm.
A strong low-pressure system tracked over Northeastern Ontario on December 11 and brought snow, freezing rain, rain and wind. Strong winds blasted through southern Ontario and Quebec knocking out power over 100,000 households, while warm air flooded into the regions breaking records. Toronto even hit 17.9 °C!
Into 2022…
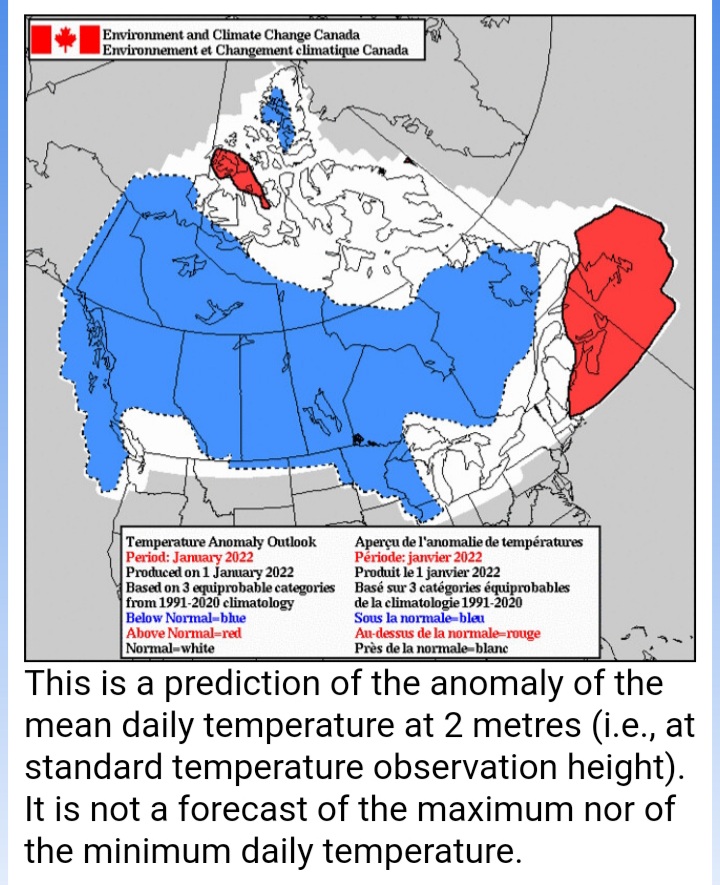
Let’s start this new year by having a look at the forecast for the “temperature anomaly” for the month of January. The temperature anomaly is the “difference from normal temperatures” for the entire month.
The forecasts are categorized as:
- blue indicates below normal temperatures;
- white (no colour) indicates near-normal temperatures; and
- red indicates above normal temperatures – all categories are compared to the 30 seasons of the 1981-2010 period.
Long-range forecast user guide.